
Bodic ESG & Impact
Your portfolio companies fill in one Excel workbook per company per year. You end up with files, not a database. The ESG & Impact module replaces that process with online collection that keeps the history, the comparability and the evidence.
Why the annual Excel workbook no longer scales
A non-financial questionnaire circulated as a spreadsheet works in year one. By year three, the real cost shows.
One file per company per year
No history, no comparison between companies: every multi-year analysis is redone by hand, from workbooks whose columns have moved.
Fragile formulas
Hidden sheets, cells unlocked by accident, diverging versions in circulation. You discover the error when consolidating, which is to say too late.
Manual chasing
Who replied, who replied partially, who never opened the file: the information lives in an inbox.
Aggregation redone every year
The indicators you publish to your investors are rebuilt by hand, with no record of what was included, what was excluded and why.
Any change means recirculating
Adding three questions means a new file, therefore a new version in circulation, therefore the loss of comparability with the previous year.
No evidence behind what you publish
A figure sent to an investor does not know where it came from: neither which companies it covers, nor which version of the questionnaire it rests on.
Not one more workbook, a base of comparable reporting years
The module builds on the portal's campaign engine: statuses, deadlines, reminders, review, history and audit log are the ones your teams already use for financial collection. On top of that comes what non-financial reporting demands in its own right.
- Versioned questionnaires, question-by-question review, calculated indicators and a score.
- A profile per company and consolidation at fund level.
- A base fed by the companies themselves, where every published value knows where it came from.
A published questionnaire never moves again
A campaign freezes its version at launch, which guarantees that 2025 and 2026 stay comparable even if the questionnaire changed in between.
Versioned and immutable
Questions carry a stable code, a displayed number, a regulatory reference, contextual help, an answer type, a unit, input constraints and a display condition. Sections can be restricted to certain segments, and answers carry over from one year to the next.
Imported from your Excel
An editor lets you build a questionnaire on screen or import it from an existing workbook: you start from the questionnaire you already use rather than retyping it. A published version can be duplicated to prepare the next one without touching the one in the field.
Segment and size
Two axes combine: the variant, meaning the segment the company belongs to, and the size band derived from headcount according to your own thresholds. A company classified "industry, over 250 employees" does not read eighty questions to answer thirty.
One request a year, even across several funds
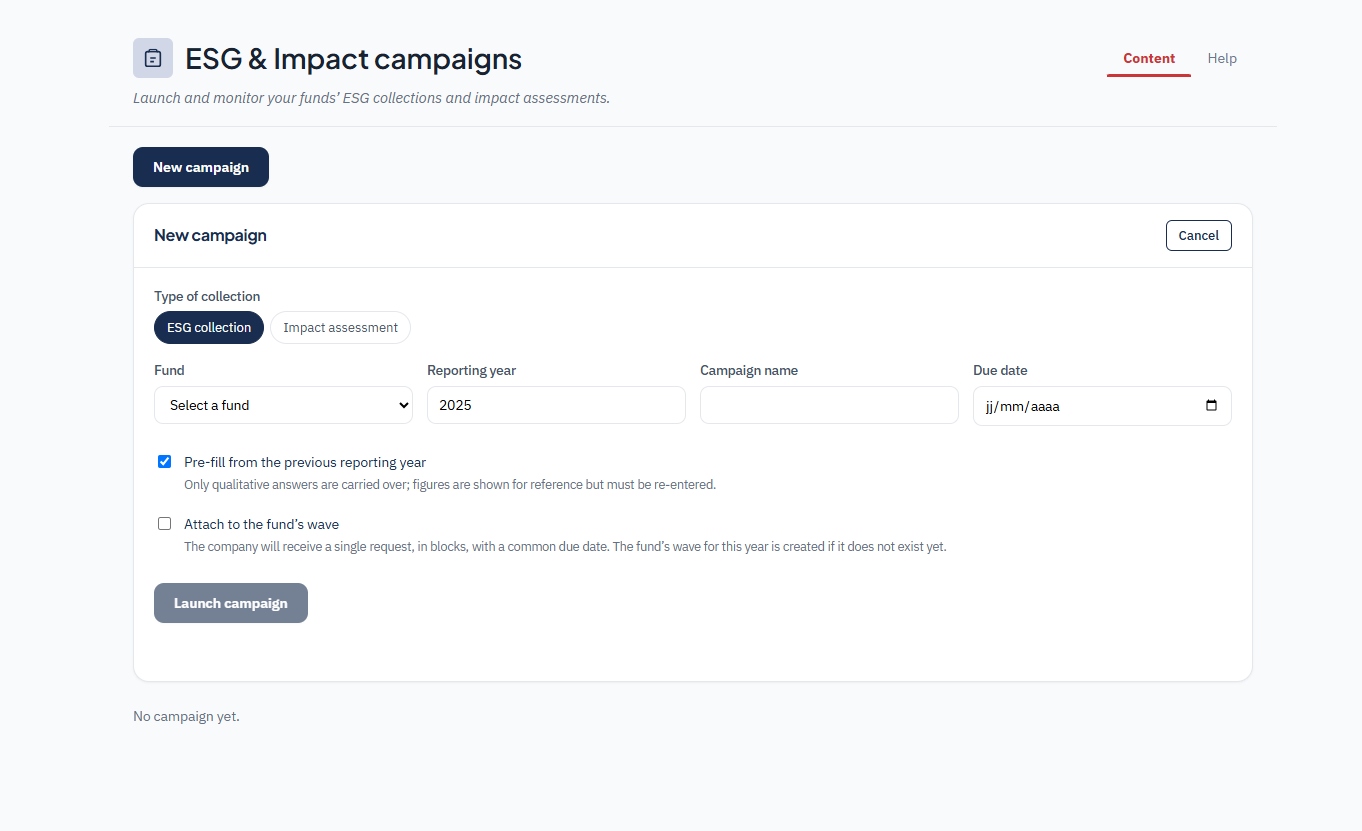
A campaign targets the holdings of a fund for a given year. A collection wave groups a fund's campaigns for one year: the company sees a single request, organised in blocks, with a common deadline and overall progress.
- One answer per company per year. If a holding is owned by two of your funds, it does not fill in the form twice: each fund then consolidates that same answer with its own weighting.
- At launch, each company receives its variant and size band, an optional pre-fill from its last validated answer, and an email.
- A question can read a value already given in another block: it shows as read-only and freezes on submission. If the source value later changes, the line is flagged "to review" rather than silently altered.
- Automatic reminders with ESG-specific offsets, plus targeted manual chasing from the campaign detail.
You do not accept an answer as a block
Each question is either validated or sent back for correction, with a mandatory comment that opens a thread with the company. The company replies in the thread and corrects; the question returns to pending review.
- Final validation requires that no correction remains open.
- It freezes a snapshot: answers, calculated indicators, score by dimension, materiality map, completion rate. It survives the deletion of the campaign that produced it.
- Reopening a validated answer requires a reason, which is recorded. Every action is logged and visible in the history.
Rate it, do not compute it
Impact cannot be inferred from a questionnaire. A score computed automatically from self-declared answers produces a figure nobody will defend in front of a committee. The module therefore separates three sources, question by question.
The company declares
Data only the company can know, entered in its own form.
An external reference
Sector or macroeconomic data, versioned, that the company never sees.
The team judges
A rating given by your analysts, refused without written justification at the moment it is saved rather than at validation. The methodology itself is configurable: dimensions, scoring formula, rating bands. Once used by an assessment, it becomes immutable.
What you publish to your investors
This is where most Excel processes break. The module makes it a first-class object, and two exports accompany the reporting: a regulatory report and a datapack for your investors.
- The indicator set belongs to the fund, not to the product: two funds do not consolidate the same list. Every calculated value keeps a record of the set that produced it.
- Each indicator declares its consolidation method: sum, weighted average, or portfolio ratio. Weighting is based on your position, invested amount by default.
- A non-answer excludes, it never substitutes. A company without a validated answer drops out of the calculation; last year's value is never carried into an aggregate.
- Every value carries its coverage. "n companies included out of m" is computed on the whole portfolio, stored with the value, and shown everywhere the figure appears, exports included.
- Consolidating is publishing: the calculation is triggered explicitly, logged with the coverage obtained, and built from the validated snapshot, never from an answer still in progress.
Your past reporting years from day one
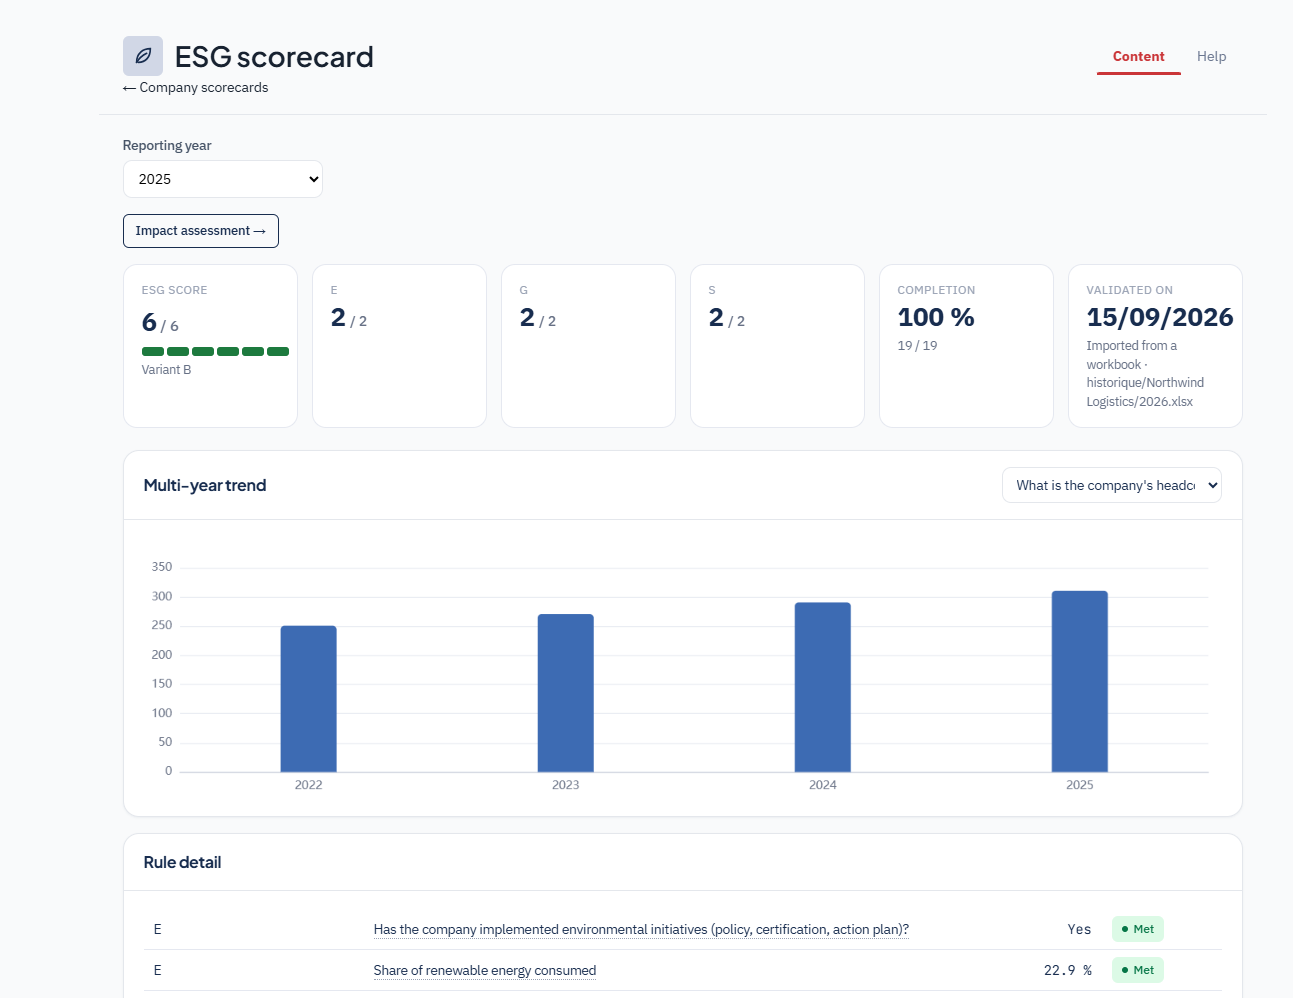
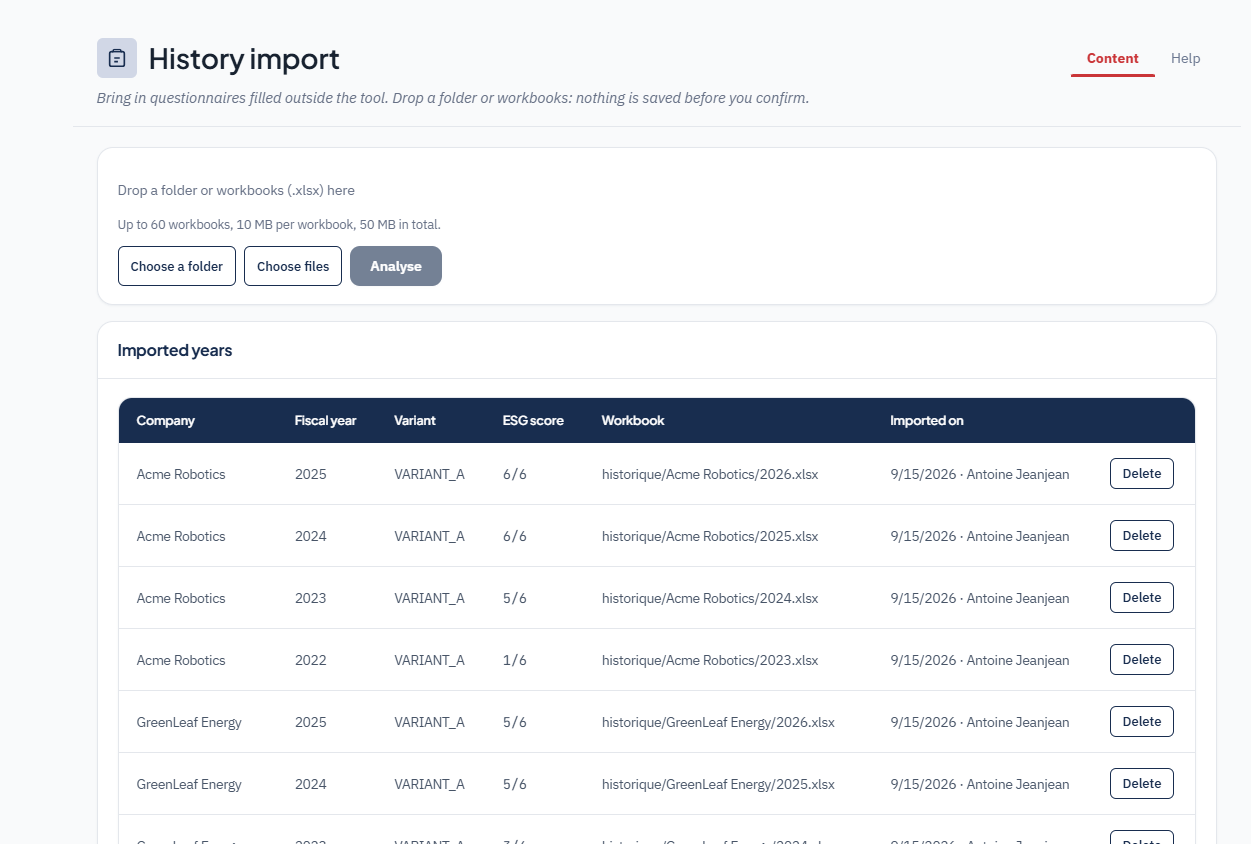
A collection module that starts empty has nothing to show for two years. Yours starts with your history: you upload the workbooks your holdings have already filled in, including several generations of questionnaire whose rows and numbering have moved.
- The platform matches each answer by its wording, suggests the company from the folder structure, and infers the reporting year.
- A review report before anything is written: what was read, what was set aside and why, and which questions are absent from your own questionnaire.
- The score is recalculated by your published questionnaire, never taken from the workbook. If the workbook showed a different figure, the gap is explained to you rather than absorbed.
What you configure without development
Everything that varies from one management company to another is configured on screen. Your vocabulary, your segments, your thresholds: not a development, an administration screen.
Compare any indicator
An explorer compares any numeric question or calculated indicator across the whole portfolio, year after year: median, total, leading company, gap to median, variation, coverage. CSV export. Only validated answers enter the comparison.
Your options, your wording
Score visible to companies, one answer per year, partial submission, carry-over between years, reminder offsets. Assignment of a questionnaire to each fund, variants and headcount thresholds, multilingual overrides for every label.
A module, not a separate tool
Same users, same permissions, same navigation, same audit log as the rest of the Portfolio Portal. Enabled by role and by user, off by default for holdings. Six languages end to end. A user restricted to certain funds sees only their own scope.
Security and traceability
Two-factor authentication, time-limited sessions, documents encrypted at rest and in transit. Audit log on every sensitive action. Strict separation: a holding only reaches its own data. Hosted in France, one dedicated instance per management company.
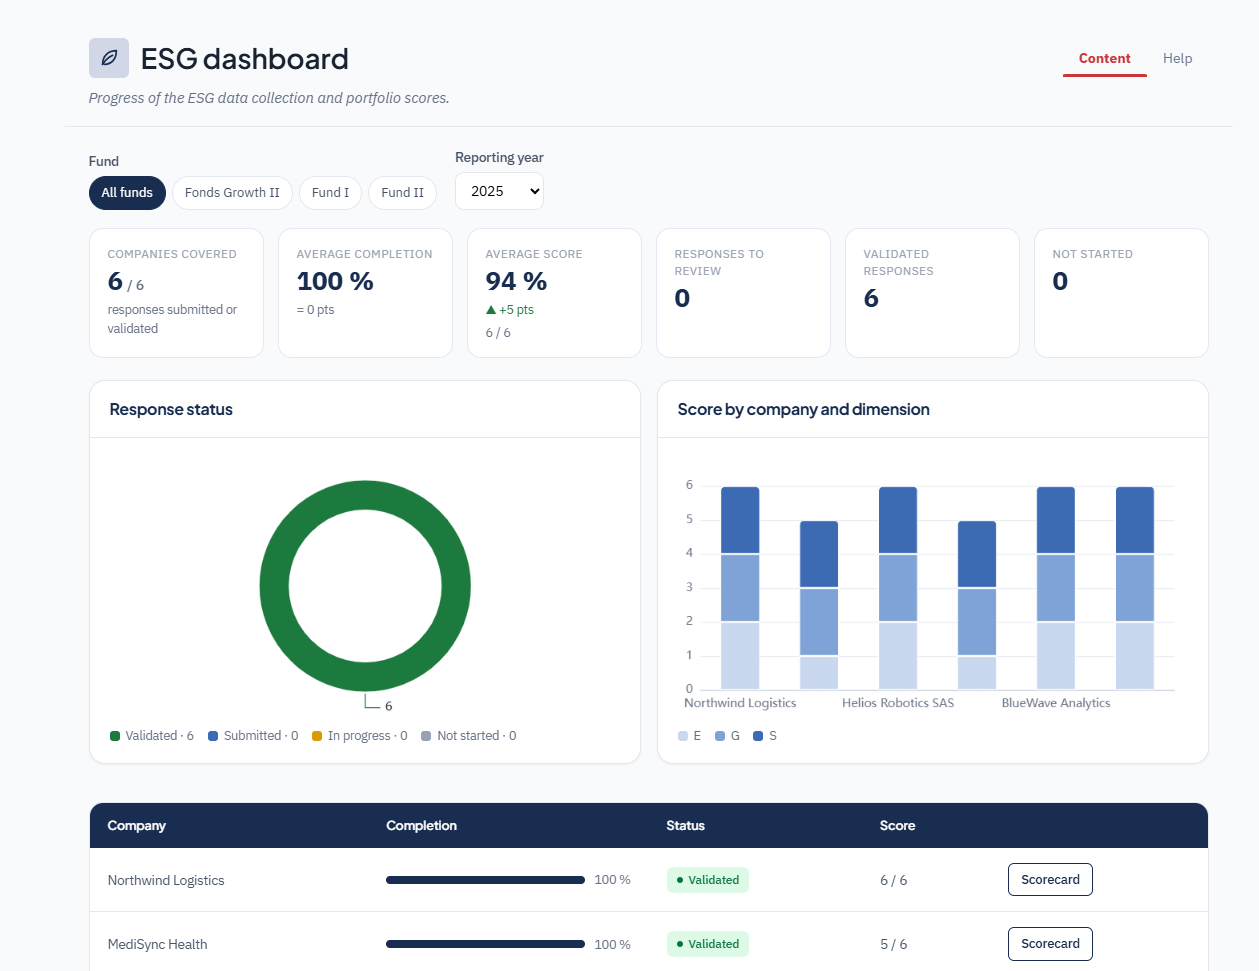
The screens of the module
Four views of the back office, as your teams see them.
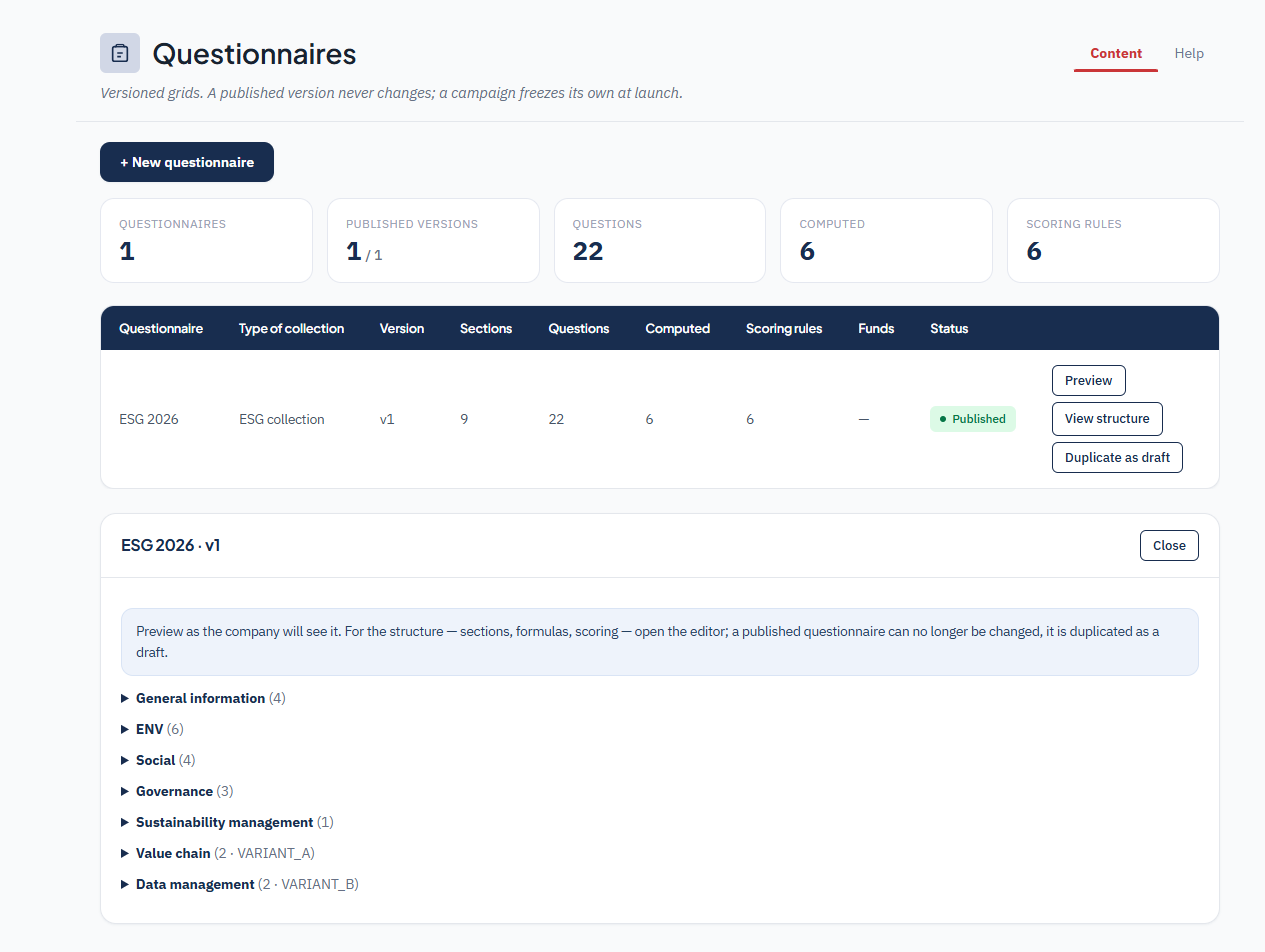
Versioned questionnaires
The list of questionnaires, their published version, the number of questions, computed indicators and scoring rules. A preview shows the questionnaire exactly as the company will see it.
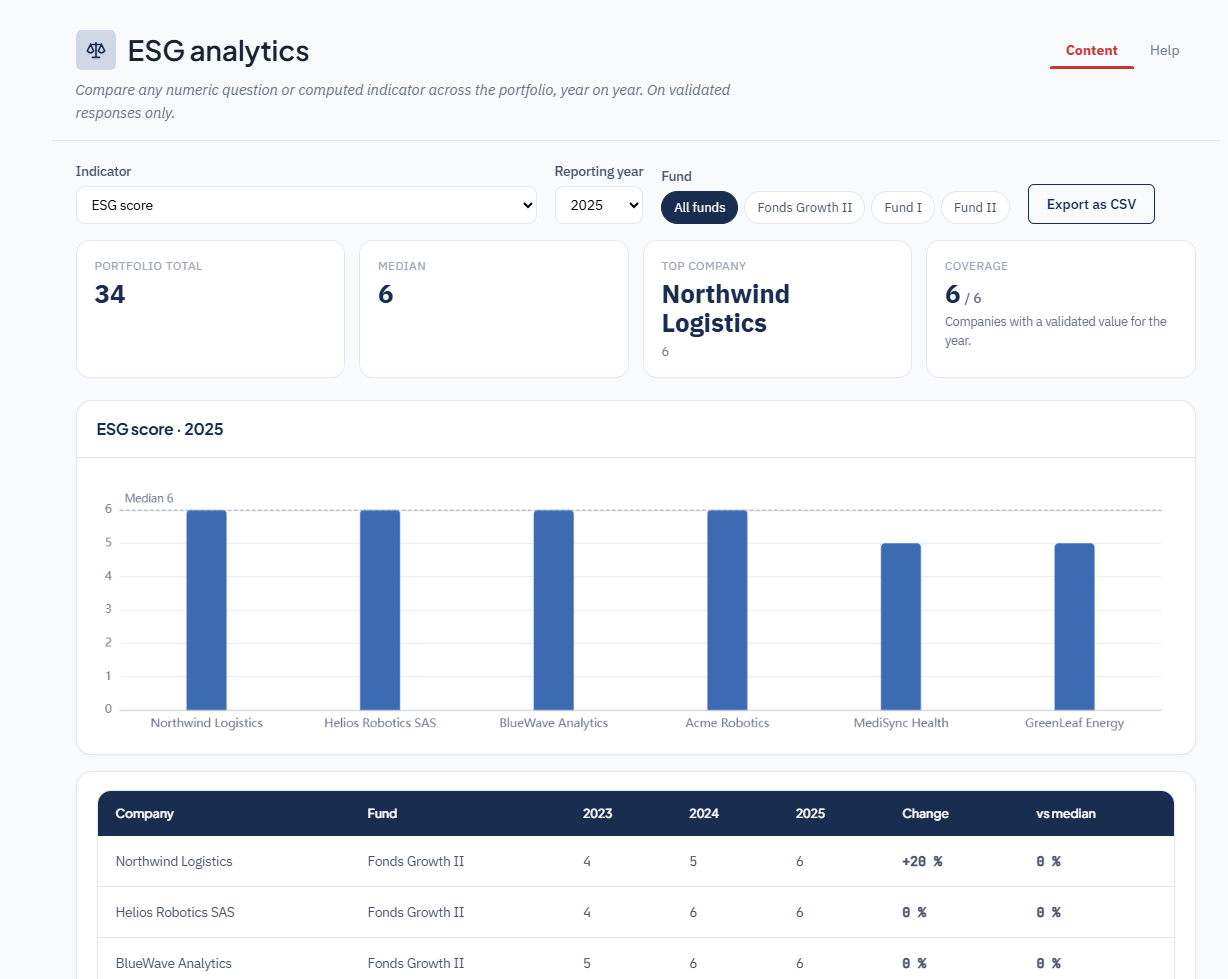
Portfolio analytics
Any numeric question compared across the whole portfolio: total, median, leading company, gap to median and coverage, year after year. CSV export.
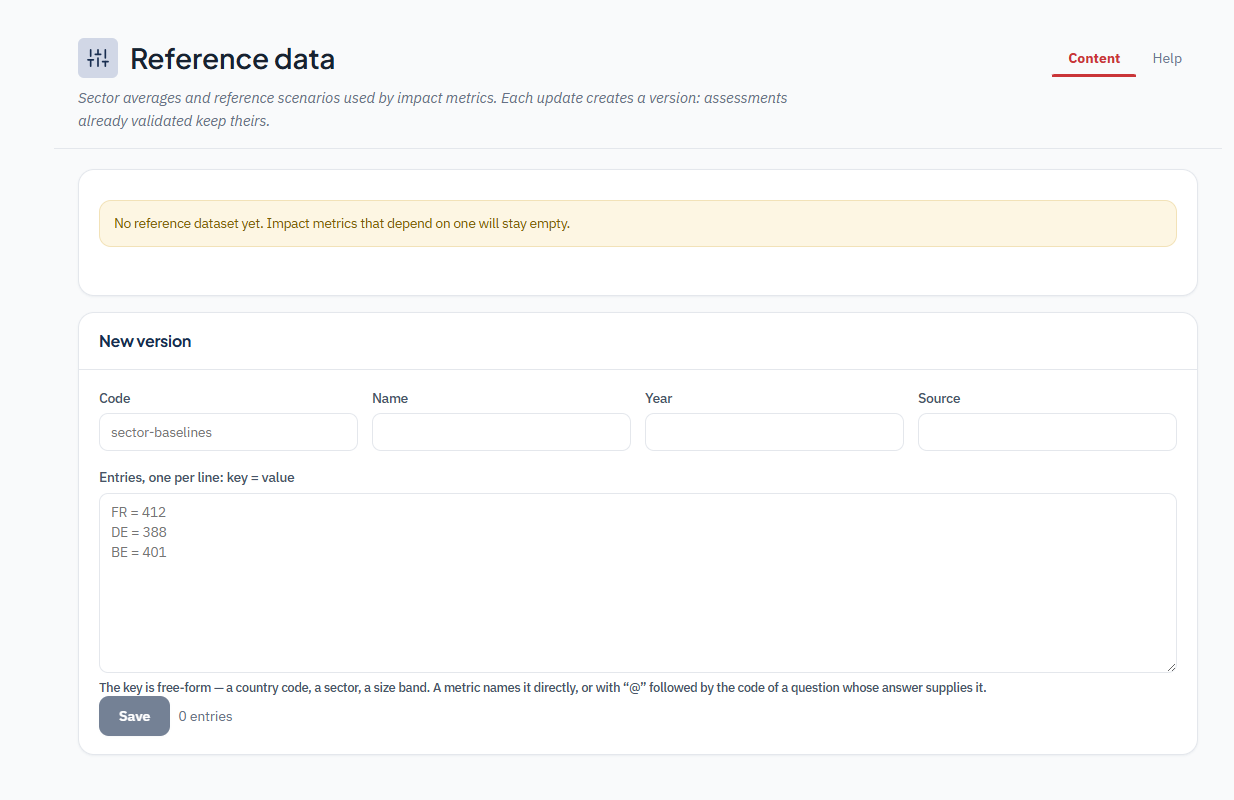
Reference data
The sector averages and reference scenarios used by impact metrics. Each update creates a version: assessments already validated keep theirs.
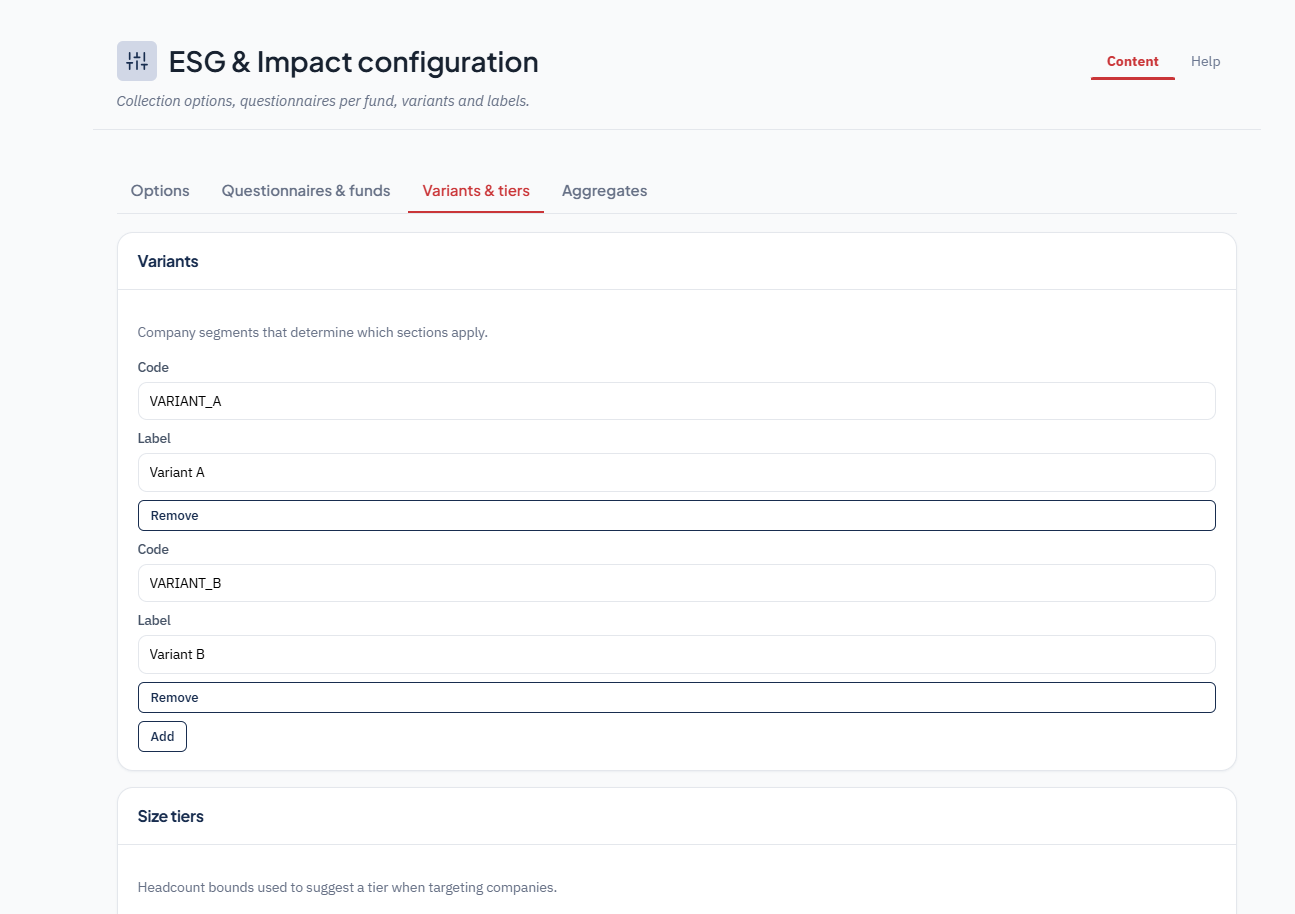
Configuration
Collection options, questionnaires assigned per fund, variants and headcount tiers, aggregation sets. Your vocabulary and your thresholds, with no development.
What sets us apart
Four comparisons, and a method.
Against a spreadsheet sent by email
History, comparability, completion tracking and consolidation stop being manual work.
Against a general-purpose ESG platform
The module lives in the portal your holdings already use for their financial reporting. One login, one point of contact, one annual request.
Against in-house development
Questionnaires, segments, size bands, aggregation sets and impact methodology are data you configure, not code to rework for every campaign.
On method
Exclusion rather than substitution, coverage shown on every figure, a rating refused without justification, consolidation treated as a publication. Choices of rigour that hold up in front of an investor and in front of an auditor.
What it changes, for each of you
ESG team and portfolio managers
Launch a fund's annual collection in minutes, follow completion in real time, request a targeted correction without reopening the whole questionnaire, validate, and immediately have a profile per company and a portfolio comparison.
Middle Office and investor reporting
Produce a fund's regulatory report and datapack from validated data, with each indicator's coverage shown. Answer an investor question about a published figure by showing where it came from.
Portfolio companies
One request a year, even when several funds hold the capital. A form that only shows the applicable questions, remembers last year, saves itself and works from a phone.
A module of the Bodic Portfolio Portal
Non-financial data compares with the financial indicators of the same company, in the same portal.
Bodic Portfolio Portal
Financial collection and campaign engine
Bodic LP Portal
Reporting to investors
Bodic ESG & Impact
New
Bodic Golden Source
Holdings reference data
Bodic BI
Consolidated dashboards
Bodic Data Room
Supporting documents
What our clients ask us
Do we have to abandon our current questionnaire?
No. An editor imports your existing workbook and turns it into a questionnaire: you start from what you already use rather than retyping it. Your already-collected years can be loaded too, across several generations of questionnaire.
What happens if a company does not answer?
It drops out of the calculation, and the indicator's coverage says so: "n companies included out of m", shown everywhere the figure appears. Last year's value is never reused to fill the gap. Exclusion is explicit; substitution does not exist.
Does a company held by two of our funds answer twice?
No. One answer per company per year: the second fund's campaign attaches to the answer already collected. Each fund then consolidates that same answer with its own weighting and its own indicator set.
What exactly does a portfolio company see?
Its own form, its own profile, and its score only if you have enabled the option and validated its answer. Never the dimension-by-dimension detail of an impact rating, never the justifications, never the external reference data.
Where is this data hosted?
In France, on Clever Cloud infrastructure, with one dedicated instance per management company and no database shared between clients.
Let's move to a demonstration
We will show you the module on a questionnaire close to your own, with your segments and your size bands.